Synapex — Business Analysis & Data Analytics · Verify MBCS
Validation & Testing
← Power BI Dashboards & User Experience · Project Overview · Requirements and Delivery Tracebility →
Overview
Validation was performed throughout the solution rather than being treated as a final visual check after dashboard development.
The completed Azure DevOps Governance Analytics solution was tested from source data through Power Query transformations, semantic-model behaviour, DAX calculations and final report output.
Expected results were defined against the business requirements and business rules so that the implemented solution could be evaluated objectively.
Validation Approach
Testing covered several layers of the analytical solution:
- Source validation — confirm that the expected Azure DevOps work-item population and fields were being retrieved.
- Transformation validation — confirm that Power Query produced the expected current-state, historical and requirements-completeness structures.
- Semantic-model validation — confirm table grain, relationships, filter propagation and analytical populations.
- Business-rule validation — test approval-governance and requirements-health classifications against controlled scenarios.
- Measure validation — reconcile DAX outputs to independently understood populations.
- Report validation — test KPIs, visual totals, slicers, reset behaviour, navigation and summary-to-detail consistency.
- Performance validation — use Power BI Performance Analyzer to identify and assess visual execution times.
- Regression testing — retest affected behaviour following defect resolution.
A dedicated Validation / Model Validation page was retained in the PBIX to support technical reconciliation without exposing development controls through the normal business navigation.
Test Design
Tests were based on expected business behaviour rather than simply checking whether a visual displayed a value.
Representative test areas included:
| Test Area | Validation Question |
|---|---|
| Approval request status | Is the correct current approval population identified? |
| Responsible Authoriser | Is the defined Senior Authorised By / Authorised By precedence applied correctly? |
| Approval-period start | Is the current continuous approval period identified correctly from history? |
| Overdue classification | Does an active request become overdue at the seven-day threshold? |
| Requirements completeness | Are missing mandatory fields identified correctly? |
| Feature parent | Is the current parent validated as an actual Feature? |
| Health classification | Are Healthy, Attention Required and Critical assigned according to the defined precedence rules? |
| Health reasons | Are all applicable issue reasons retained? |
| Executive reporting | Do headline KPIs reconcile to the underlying User Story population? |
| Filtering | Do slicers affect all intended measures and visuals consistently? |
| Navigation | Do principal report-page navigation controls behave consistently? |
| Performance | Do report visuals execute within the defined performance thresholds? |
Project Evidence
Model Validation Page
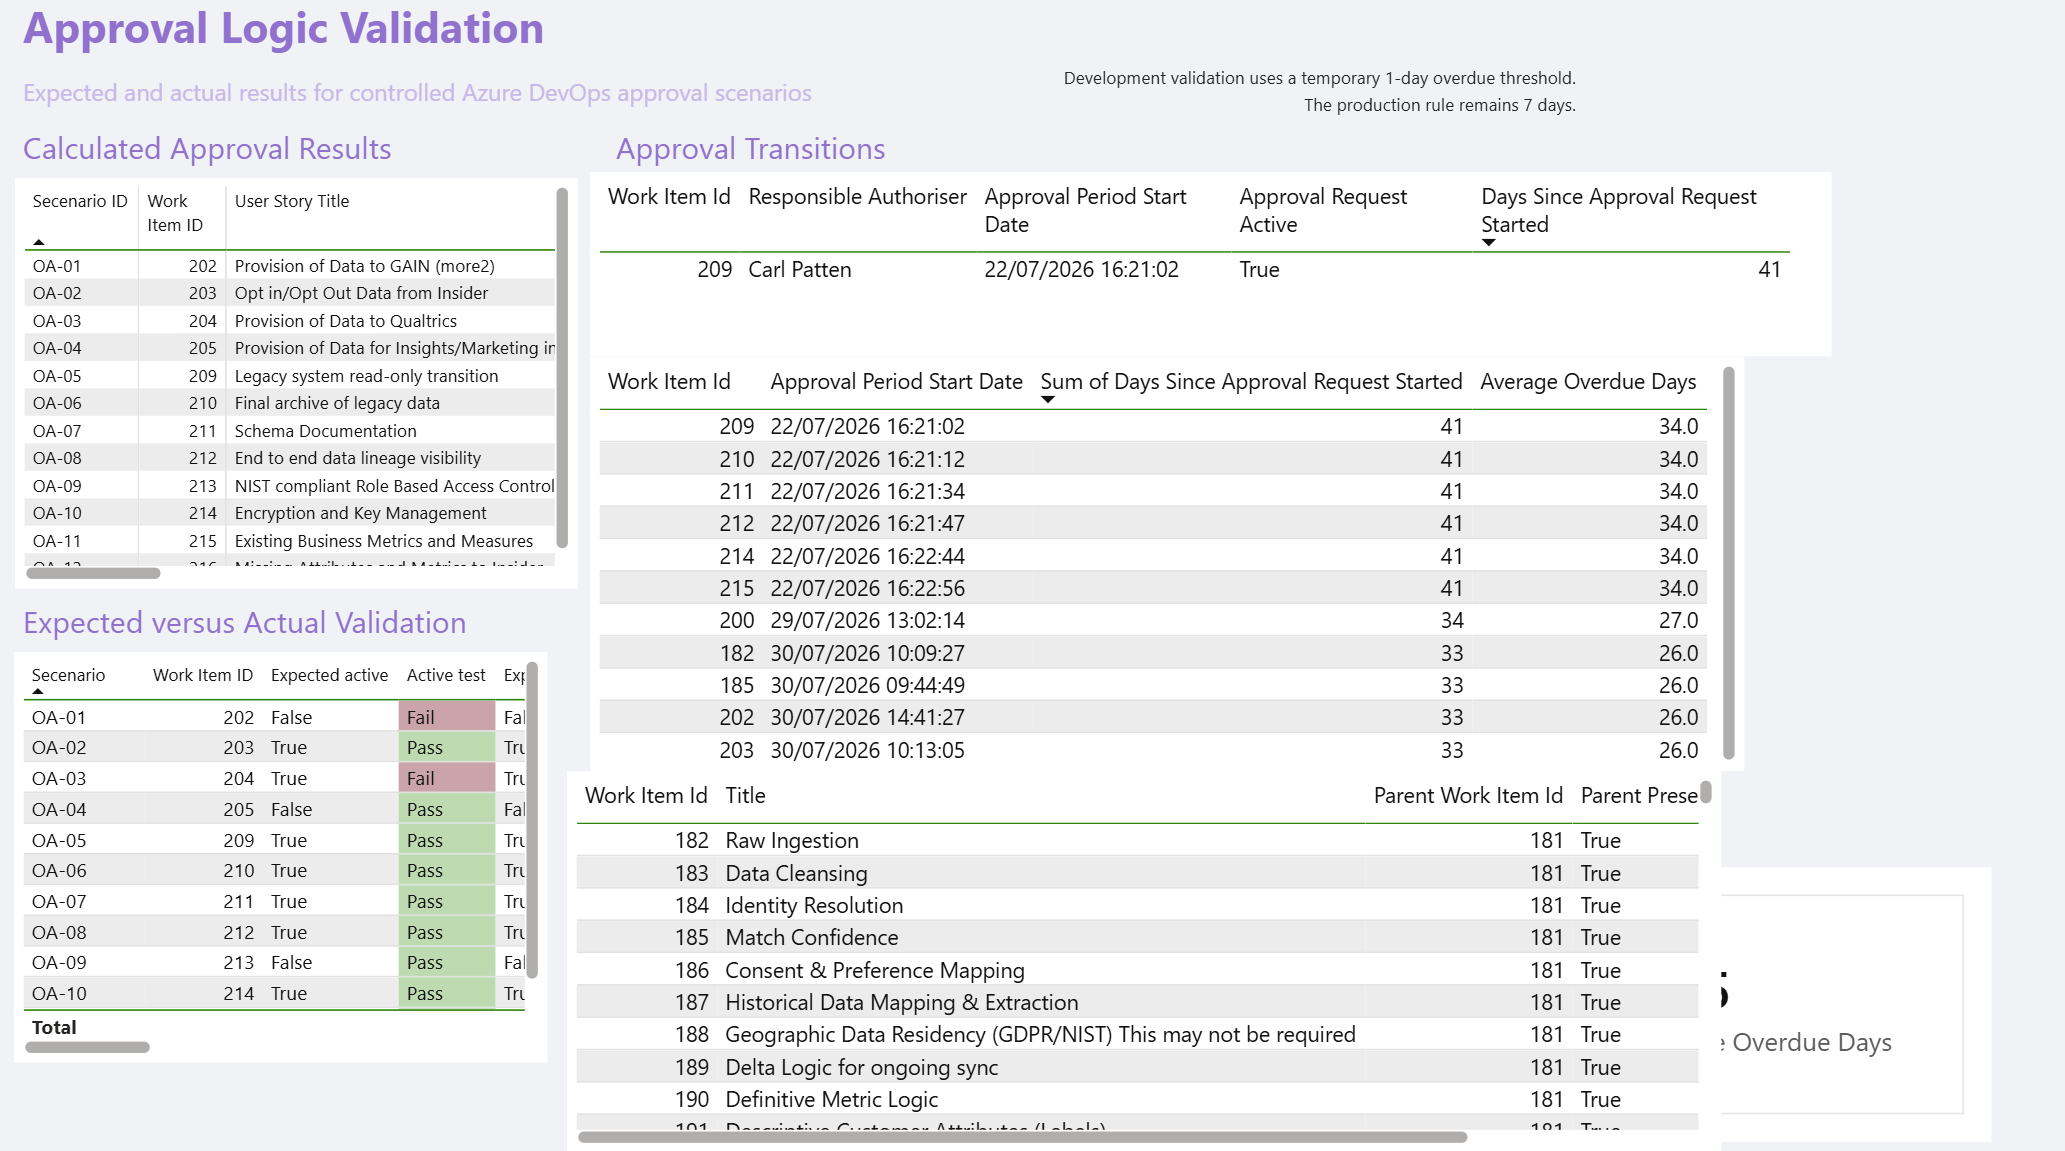
Dedicated Power BI validation page used to reconcile analytical populations, classifications and model behaviour during development and final testing.
What this demonstrates:
Validation capability was built into the Power BI solution itself. Technical reconciliation could therefore be performed against the same semantic model used by the business-facing dashboards rather than relying solely on manual inspection of report visuals.
Executive Approval Reconciliation
Following the final portfolio refresh, the Executive Governance Overview reported:
| Approval Position | Requirements |
|---|---|
| Approved | 3 |
| Not Submitted | 114 |
| Awaiting Approval | 0 |
| Overdue Approval | 11 |
| Total Requirements | 128 |
The reconciliation therefore confirmed:
3 Approved
+ 114 Not Submitted
+ 0 Awaiting Approval
+ 11 Overdue Approval
= 128 Total Requirements
What this demonstrates:
The executive approval categories reconcile exactly to the current User Story population. This helps detect duplicated records, missing classifications or filter-context problems within the semantic model.
Requirements-Health Reconciliation
The same current requirement population was independently reconciled through the requirements-health classifications:
| Requirements Health | Requirements |
|---|---|
| Healthy | 113 |
| Attention Required | 4 |
| Critical | 11 |
| Total Requirements | 128 |
The reconciliation confirmed:
113 Healthy
+ 4 Attention Required
+ 11 Critical
= 128 Total Requirements
This also produced a final Healthy Requirements Percentage of 88.3%.
What this demonstrates:
Healthy, Attention Required and Critical are mutually exclusive overall classifications and collectively account for the complete current requirement population.
Exception Validation
The Executive Governance Overview reported the following material governance indicators:
| Exception Indicator | Count |
|---|---|
| Overdue Approvals | 11 |
| Critical Requirements | 11 |
| Attention Required | 4 |
| Completed / Closed Unapproved | 0 |
These values are deliberately not summed into one total because an individual User Story may satisfy more than one exception condition.
The report therefore includes the explanatory subtitle:
Exception indicators may overlap
What this demonstrates:
Validation considered the meaning of analytical populations as well as their numerical accuracy. Independent measures are not incorrectly presented as mutually exclusive categories.
Business-Rule Validation
Controlled scenarios were used to test key analytical rules.
Representative examples included:
| Scenario | Expected Result |
|---|---|
| Authoriser populated, requirement unapproved and approval age below seven days | Active approval request, not overdue |
| Active approval reaches seven whole calendar days | Overdue approval |
| Both authoriser fields populated | Senior Authorised By selected as Responsible Authoriser |
| Neither authoriser field populated | Requirement classified as Not Submitted |
| Mandatory requirement information missing | Attention Required where no Critical condition applies |
| Active approval overdue | Critical |
| Requirement completed or closed while remaining unapproved | Critical |
| Multiple health conditions present | One overall status plus all applicable Health Reasons |
| No applicable governance or completeness condition | Healthy |
What this demonstrates:
The implementation was tested against controlled examples of the underlying business rules rather than relying only on naturally occurring source records.
Filter and Interaction Validation
Report behaviour was also tested under different filter conditions.
Tests covered:
- Area Path filtering;
- Iteration Path filtering;
- combined Area Path and Iteration Path filtering;
- Responsible Authoriser filtering where applicable;
- Requirements Health Status filtering on the Requirements Health page;
- reset / Clear all filters behaviour;
- interaction between KPIs and supporting visuals; and
- principal-page navigation.
The Executive Governance Overview was specifically validated to confirm that both Area Path and Iteration Path affected all six KPI cards and the four supporting visuals consistently.
What this demonstrates:
Validation extended beyond individual DAX values to the behaviour of the report as an interactive analytical application.
Performance Validation
Power BI Performance Analyzer was used to measure visual execution time on the completed report.
Selected recorded results include:
| Report Page | Slowest Recorded Visual |
|---|---|
| Executive Governance Overview | 120 ms |
| Approval Governance Summary | 125 ms |
| Overdue Approval Exceptions | 123 ms |
| Validation / Model Validation | 89 ms |
Performance Analyzer Evidence
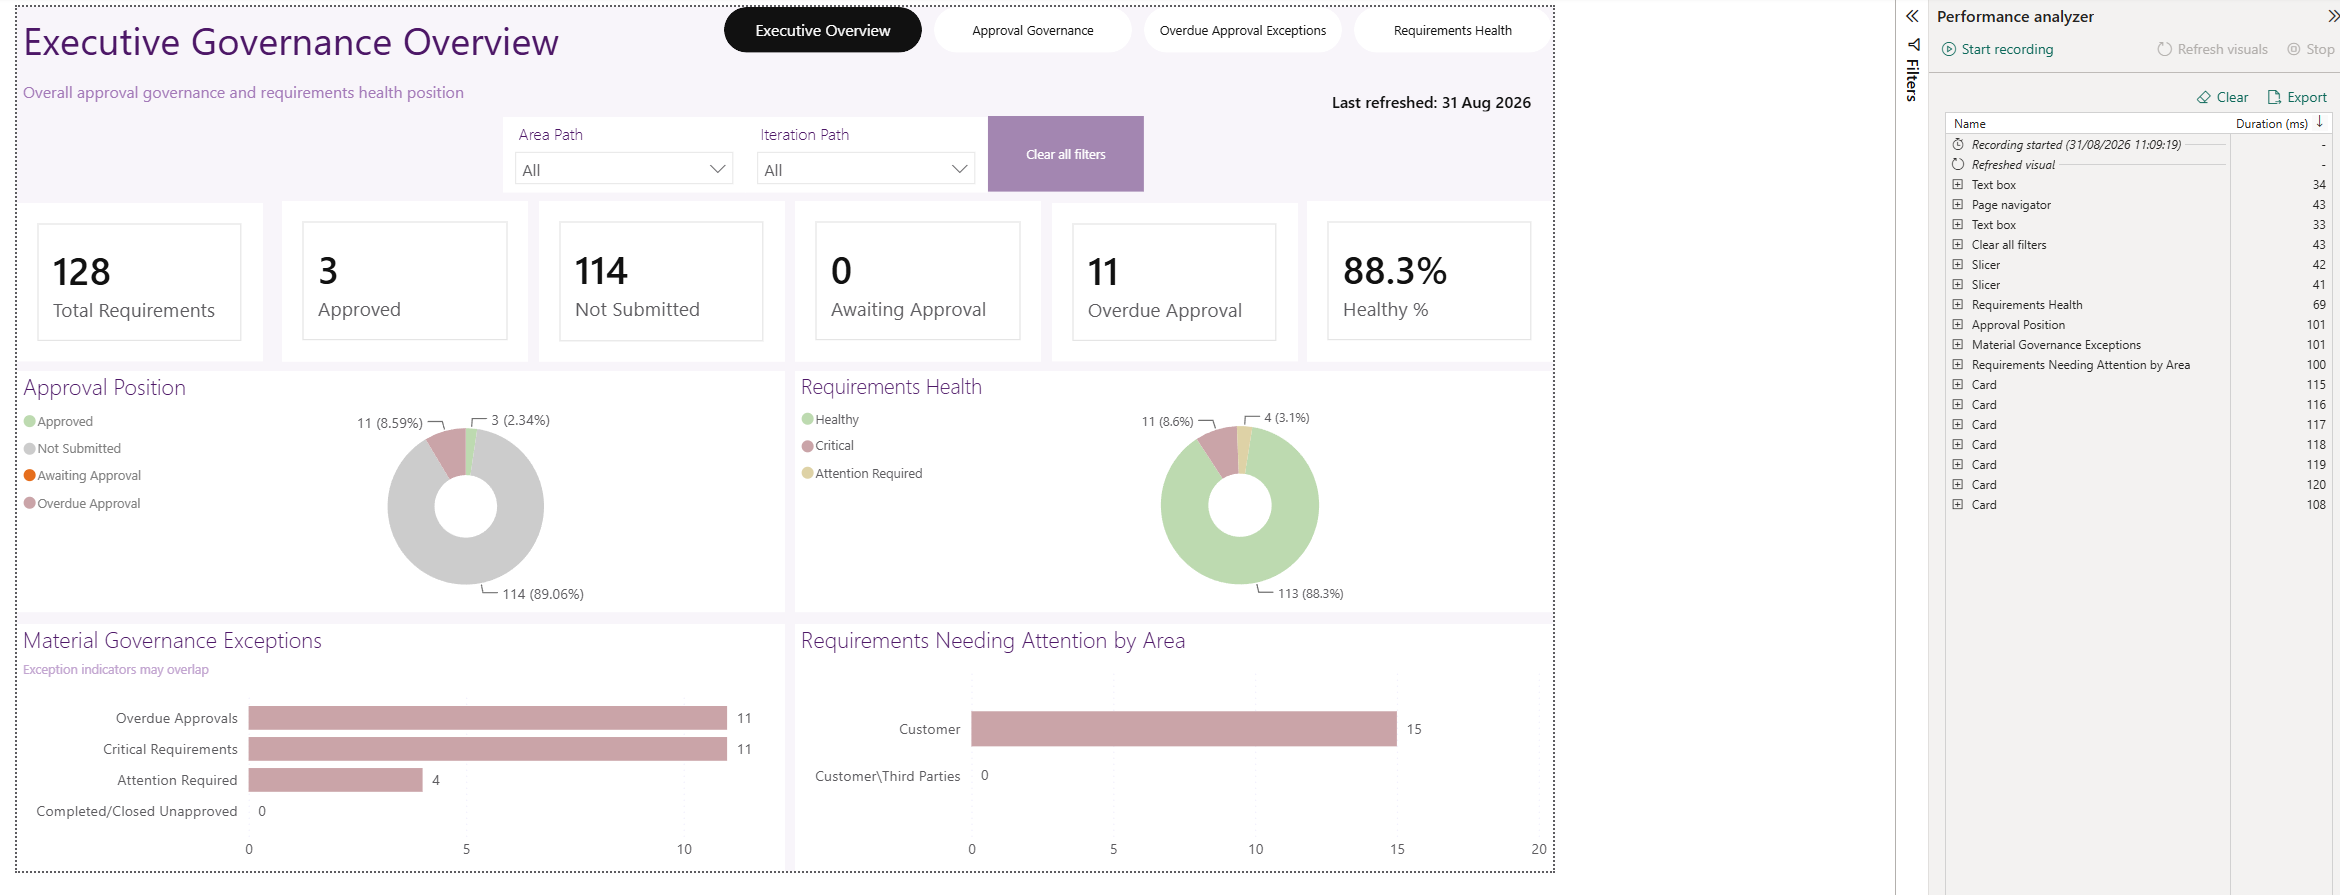
Power BI Performance Analyzer evidence captured during final validation of the Executive Governance Overview.
What this demonstrates:
Report performance was measured using Power BI’s diagnostic tooling rather than judged subjectively from perceived responsiveness.
Defect Resolution and Regression Testing
Testing identified implementation defects during development.
Six recorded defects were corrected and the affected behaviour was subsequently retested.
The controlled validation record retains the individual defect, expected behaviour, correction and retest evidence.
This ensured that a successful correction did not simply close the original issue without confirming that the intended business behaviour had been restored.
What this demonstrates:
Defect management and regression testing formed part of the delivery process, providing an audit trail from identified issue through correction to successful retest.
Validation Outcome
The final controlled test execution recorded:
| Validation Result | Outcome |
|---|---|
| Tests executed | 56 |
| Passed | 56 |
| Failed | 0 |
| Final result | PASS |
The completed portfolio solution therefore passed the defined validation criteria across data preparation, semantic modelling, business logic, report behaviour and performance.
Evidence Presented
The public case study presents selected evidence of:
- structured test design;
- expected-versus-actual validation;
- source and transformation checks;
- semantic-model reconciliation;
- approval-governance business-rule testing;
- requirements-health business-rule testing;
- executive KPI reconciliation;
- filter and interaction testing;
- Performance Analyzer testing;
- defect resolution and regression testing; and
- final validation outcome.
Only representative validation evidence is published. The complete Test and Validation Record, controlled test data and detailed defect evidence remain within the project documentation.
← Power BI Dashboards & User Experience · Project Overview · Requirements and Delivery Tracebility →
© 2026 Carl Patten. All rights reserved.