Synapex — Business Analysis & Data Analytics · Verify MBCS
Semantic Model
← Data Preparation · Project Overview · Power BI Dashboards & User Experience →
Overview
The semantic model converts the prepared Azure DevOps datasets into reusable analytical structures supporting approval governance, requirements health, executive reporting and controlled validation.
The model was designed around the grain required by each analytical purpose rather than combining all source data into a single table.
This separation allows current-state KPIs, historical approval analysis and issue-level requirements-health reporting to coexist without introducing ambiguous counts or unnecessary relationship complexity.
Model Design Approach
The implemented model contains six material analytical tables supported by a small disconnected presentation helper.
The principal analytical tables are:
ApprovalHistoryCurrentApprovalsApprovalPeriodSummaryRequirementFieldStatusFeatureWorkItemIDsRequirementsHealthReasons
A disconnected Executive Exception Type table supports presentation of the controlled exception categories used on the Executive Governance Overview.
Analytical Table Roles
| Table | Grain | Purpose |
|---|---|---|
CurrentApprovals |
One row per current User Story | Central current-state reporting population for approval governance, requirements health and executive KPIs |
ApprovalHistory |
One row per User Story per historical snapshot date | Preserves approval history required to reconstruct and analyse approval periods |
ApprovalPeriodSummary |
One row per current User Story | Stores the derived current approval-period summary used by approval-age analysis |
RequirementFieldStatus |
One row per current User Story | Stores current requirements-completeness indicators derived from source-field assessment |
FeatureWorkItemIDs |
One row per valid Feature work-item ID | Provides a controlled lookup population for validating User Story parent relationships |
RequirementsHealthReasons |
One row per User Story per applicable issue reason | Supports issue-level analysis where a single requirement can have more than one health problem |
Presentation Helper
Executive Exception Type is a small disconnected helper table that provides the controlled category axis for the Material Governance Exceptions visual.
It does not represent another analytical business entity and is therefore kept separate from the six material analytical tables.
Relationship Design
The relationships reflect the different grains of the analytical structures.
| From | To | Cardinality | Filter Direction |
|---|---|---|---|
CurrentApprovals |
ApprovalHistory |
One-to-many | Single |
CurrentApprovals |
ApprovalPeriodSummary |
One-to-one | Both |
CurrentApprovals |
RequirementFieldStatus |
One-to-one | Single |
CurrentApprovals |
RequirementsHealthReasons |
One-to-many | Single |
FeatureWorkItemIDs remains disconnected and is referenced through analytical logic when validating whether a parent work item represents a valid Feature.
Executive Exception Type is also disconnected because it exists solely to provide controlled presentation categories to a DAX measure.
Current-State as the Reporting Anchor
CurrentApprovals acts as the principal current-state table.
This gives report measures and filters a consistent one-row-per-User-Story population while allowing supporting tables to retain the grain needed for their individual analytical purposes.
This design is important because ApprovalHistory contains multiple records for each User Story. Using the historical table directly for current KPIs could otherwise cause current requirement counts to be multiplied by the number of historical snapshots.
Historical Approval Analysis
ApprovalHistory retains the daily historical records required to understand approval-state changes over time.
ApprovalPeriodSummary provides the corresponding current approval-period result for each User Story.
Separating these structures allows the model to retain detailed history while exposing a compact current-period representation for approval-age measures and reporting.
Requirements-Health Model
Requirements-health reporting combines several analytical inputs.
RequirementFieldStatus provides current completeness indicators for mandatory requirement information.
FeatureWorkItemIDs supports validation of parent Feature relationships.
The resulting health logic classifies each current User Story as:
- Healthy
- Attention Required
- Critical
Where several issues apply to the same User Story, RequirementsHealthReasons retains each applicable reason independently.
This means the model can distinguish between:
- the number of requirements affected; and
- the total number of individual requirements-health issues.
Business Logic and Measures
The semantic model contains reusable measures rather than embedding calculations independently into individual visuals.
Representative measure groups include:
Approval Governance
- Active Approval Requests
- Overdue Approval Requests
- Approved Work Items
- Unapproved Work Items
- Missing Authoriser Count
- Percentage Overdue
- Days Since Approval Started
- Oldest Approval Request Age
- Average Approval Request Age
- Average Overdue Days
Requirements Health
- Total Requirements
- Healthy Requirements
- Attention Required Requirements
- Critical Requirements
- Healthy Requirements Percentage
- Total Requirements Issues
Executive Reporting
- Awaiting Approval Requests
- Completed or Closed Unapproved Count
- Executive Exception Count
- Requirements Requiring Attention
Project Evidence
Implemented Semantic Model
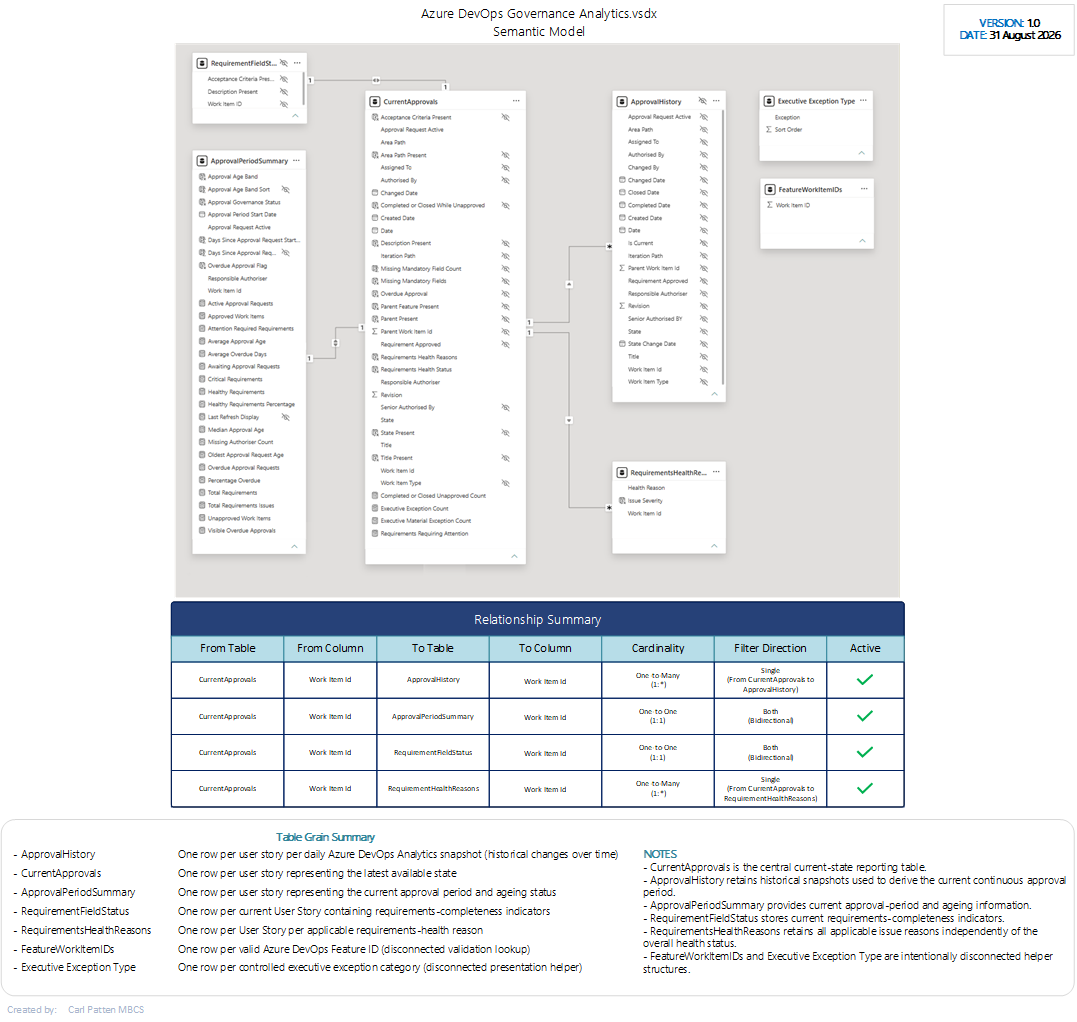
Implemented Power BI semantic model showing the separation of current-state, historical, approval-period, requirements-completeness and issue-level analytical structures.
What this demonstrates:
The model was designed around analytical grain and reporting behaviour. Current-state reporting is anchored on one row per User Story while historical and issue-level structures retain the additional records required for their specific analytical purposes.
Model Design Evidence
| Analytical Requirement | Model Design Response |
|---|---|
| Current KPIs must count each User Story once | CurrentApprovals provides one current row per User Story |
| Historical approval behaviour must be retained | ApprovalHistory retains dated work-item snapshots |
| Current approval-period information is repeatedly required | ApprovalPeriodSummary stores one summary row per current User Story |
| Requirements completeness must be assessed independently from approval history | RequirementFieldStatus stores current field-status indicators |
| Parent work items must be validated as Features | FeatureWorkItemIDs provides the valid Feature population |
| One requirement may have several health issues | RequirementsHealthReasons uses one row per applicable issue |
| Executive exception categories require a controlled presentation axis | Disconnected Executive Exception Type helper table |
| Current filters must propagate into historical analysis without allowing history to distort current counts | Controlled relationship cardinality and filter direction |
What this demonstrates:
Table grain, relationships and helper structures were chosen to solve specific analytical problems rather than replicating the Azure DevOps source schema directly.
Representative DAX — Awaiting Approval
The Executive Governance Overview distinguishes requests that are actively awaiting approval from those that have already become overdue.
Awaiting Approval Requests =
VAR ActiveRequests =
    [Active Approval Requests]
VAR OverdueRequests =
    [Overdue Approval Requests]
RETURN
    COALESCE (
        ActiveRequests - OverdueRequests,
        0
    )
Representative DAX — Material Governance Exceptions
The Executive dashboard uses a disconnected helper table and a single measure to return the appropriate value for each controlled exception category.
Executive Exception Count =
SWITCH (
    SELECTEDVALUE ( 'Executive Exception Type'[Exception] ),
    "Overdue Approvals", [Overdue Approval Requests],
    "Critical Requirements", [Critical Requirements],
    "Attention Required", [Attention Required Requirements],
    "Completed/Closed Unapproved", [Completed or Closed Unapproved Count],
    BLANK ()
)
Representative DAX — Material Governance Exceptions
The Executive dashboard uses a disconnected helper table and a single measure to return the appropriate value for each controlled exception category.
Executive Exception Count =
SWITCH (
    SELECTEDVALUE ( 'Executive Exception Type'[Exception] ),
    "Overdue Approvals", [Overdue Approval Requests],
    "Critical Requirements", [Critical Requirements],
    "Attention Required", [Attention Required Requirements],
    "Completed/Closed Unapproved", [Completed or Closed Unapproved Count],
    BLANK ()
)
What this demonstrates:
A disconnected presentation structure allows several independent governance measures to be presented through one visual without introducing artificial relationships into the analytical model.
Requirements-Health Grain Example
A requirement can have one overall health classification while also having several contributing issues.
For example:
User Story
    ↓
Overall Health Status
    Critical
    ↓
Applicable Health Reasons
    ├── Approval overdue
    ├── Description missing
    └── Acceptance Criteria missing
The User Story is counted once in the Critical Requirements KPI while each applicable issue remains available through RequirementsHealthReasons.
What this demonstrates:
The model deliberately separates requirement-level classification from issue-level analysis, preventing multiple issues on one requirement from inflating the number of affected requirements.
Model Validation
The semantic model was validated through controlled source-to-report and cross-visual reconciliation.
Validation included:
- confirming one current record per User Story;
- checking relationship cardinality and filter propagation;
- reconciling approval KPIs to detailed User Story populations;
- reconciling Healthy, Attention Required and Critical classifications to Total Requirements;
- verifying that issue-level counts can exceed affected-requirement counts where multiple reasons apply;
- validating controlled approval-age scenarios;
- testing slicer behaviour across the principal reporting pages; and
- confirming executive summary values against the underlying analytical measures.
A dedicated Validation / Model Validation page is retained within the PBIX to support this technical assurance without exposing validation controls through the principal business navigation.
Model Outcome
The semantic model provides a controlled analytical foundation for the complete reporting solution.
It supports:
- one consistent current User Story population;
- historical approval analysis;
- approval-period ageing;
- overdue-approval identification;
- requirements-completeness assessment;
- requirements-health classification;
- issue-level health analysis;
- executive governance KPIs;
- consistent filtering; and
- KPI-to-detail reconciliation.
The resulting design demonstrates that semantic modelling was treated as a distinct analytical design activity between data preparation and report presentation rather than simply as a collection of tables behind dashboard visuals.
Evidence Presented
The public case study presents selected evidence of:
- semantic-model structure;
- analytical table grain;
- relationship design;
- current-state and historical-data separation;
- requirements-health modelling;
- disconnected helper-table design;
- representative DAX measures;
- business-rule implementation; and
- model validation.
The published semantic-model diagram is a flattened, watermarked portfolio representation. The working PBIX, complete semantic-model specification and implementation artefacts remain within the controlled project environment.
← Data Preparation · Project Overview · Power BI Dashboards & User Experience →
© 2026 Carl Patten. All rights reserved.